By Fernanda Ruiz, NOVA Research Company
Alzheimer’s Disease (AD) is a devastating disease that affects more than 6 million Americans, a number that is projected to increase considerably in the near future. Scientists looking for the causes of AD use different approaches, including genomic studies like genome-wide association studies (GWAS), that detect associations between genetic variants and AD.
The discovery of myriad relevant AD genetic variants through GWAS certainly is helping make advances in understanding AD. However, differences in GWAS design and focus—association with disease risk (i.e. case-control status) versus related phenotypes (e.g. cognitive decline, family history) and inclusion of different populations—limit the AD community’s ability to leverage the richness of these findings. To address this challenge, Dr. Yuk Yee Leung (co-investigator of NIAGADS) and colleagues created the Alzheimer’s Disease Variant Portal (AVDP), an easy-to-use resource that houses the newest curated, harmonized and searchable collection of genetic association study results (Kuksa et al.).
Overview of ADVP
This resource was developed by systematically harmonizing associations from more than 200 GWAS with different study designs (i.e., age at onset (AAO), cross-phenotype, disease risk, endophenotype, and pleiotropy), including those published by the Alzheimer’s Disease Genetics Consortium (ADGC) between 2009 and 2020. To systematically harmonize data and build the ADVP, AD-related GWAS publications were collected and curated, and all association data were extracted by normalizing and validating variant and association data, and stored in the database (ADVP data schema: all curated and harmonized/derived data fields). As of August 2021, the ADVP includes data from 125 curated AD GWAS publications and contains 6,990 associations across more than 900 loci, 1,800 variants, 80 cohorts, and 8 populations.
Thus, this is a powerful tool designed to catalog the population-specific variants associated with AD, the genes reported to be associated with AD risk, and genetic variants reported to be associated with AD endophenotypes and neuropathology. The diversity and population specificity of variants in ADVP and the functionality of the ADVP interface allow users to easily explore variants by different characteristics, including population, association, type, phenotype, and cohort. For example, users can determine whether specific variants are associated with AD in different populations (e.g., Caucasian, Hispanic, African American) and compare effect sizes.
Annotation and analysis of genetic findings in ADVP
ADVP facilitates further analysis of AD-relevant findings by providing annotation of AD associations with genomic and functional information. The upstream or downstream genes and colocalized genomic elements can be found for each associated variant. ADVP allows researchers to view and search the genomic context, population frequency, trait associations, predicted effects, and functional genomics (e.g., transcription factor occupancy, expressed enhancer overlap). ADVP also supports cross-referencing of its data with other databases such as the National Institute on Aging Genetics of Alzheimer’s Disease Data Storage Site (NIAGADS) Alzheimer’s Genomics database (DB) , PubMed, gnomAD, and the University of California, Santa Cruz (UCSC) Genome Browser.
The ADVP provides several type of information not included in other AD genetic databases; for example, genome-wide significant and suggestive associations; variant, gene, SNP-SNP and gene-gene interactions; a higher number of reported variants and genes, curated AD association records and AD genetics publications; harmonization of more detailed and extensive meta-data (e.g., imputation panel, record type, population, cohort); and genomic and functional genomic annotations.
Searching ADVP
ADVP users can easily browse genetic association study results by Publication, Gene, Variant, and Association records. Variant Viewer tools (chromosome ideogram and population/phenotype) enable users to visualize findings.
1) Searching for genetic associations
In Publications, users can browse by title, first or last author, Pubmed ID, journal, or year and access ADVP genetic association records for each study. The association records can be customized to show detailed information about each variant (e.g., locus, interactions, population). Variants also can be viewed in gnomAD, GenomicsDB, and UCSC Genome Browser.
2) Searching records via genomic regions
Curated ADVP information (e.g., SNP, population, phenotype) for genetic associations in specific genomic regions can also be accessed through the Association records link (Figure 1) using genomic coordinates (e.g., chr1:6494743-6944743).
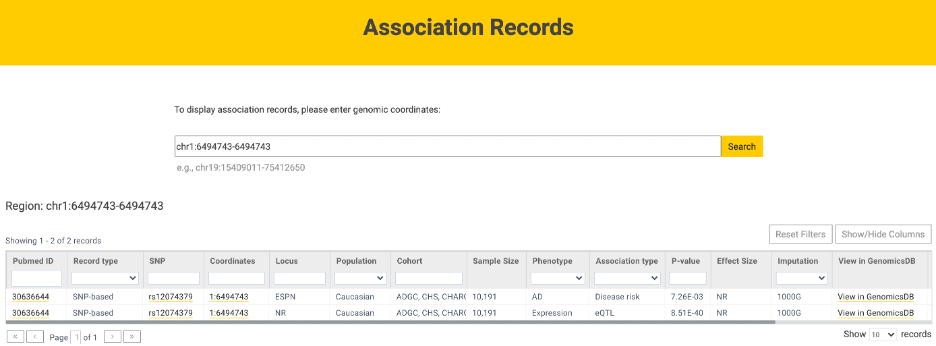
Figure 1. Association records for chr1:6494743-6944743.
3) Searching by gene names
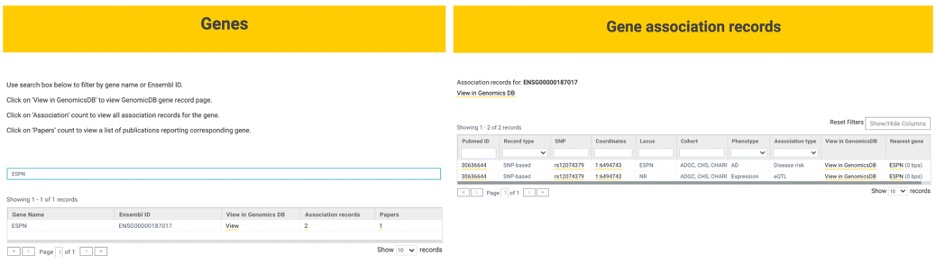
Users also can search ADVP association records by gene name (e.g., ESPN) or Ensembl database identifier and view results in GenomicsDB (Figure 2, left). All ADVP association records and studies related to specific genes can be accessed (Figure 2, right).
4) Searching for variants of interest
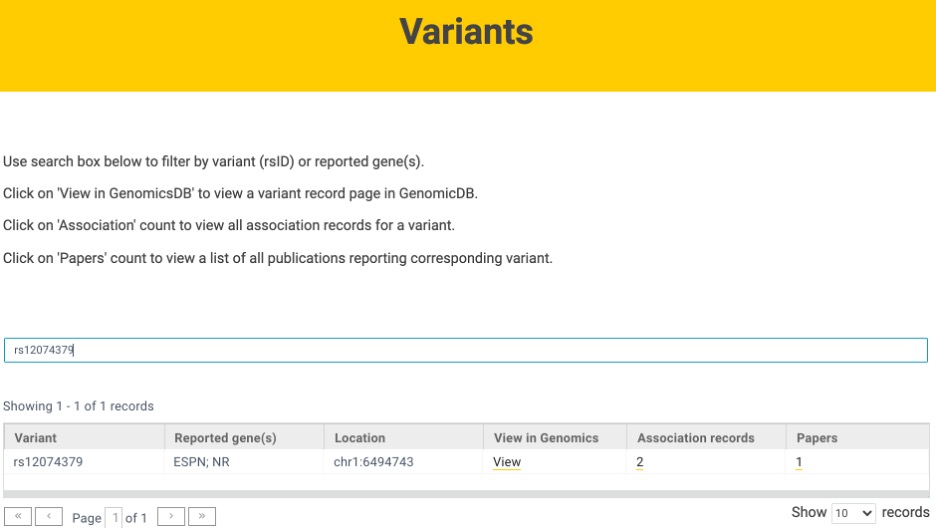
Variant searches can be conducted using the variant identifier (e.g., rs12074379) or reported gene (Figure 3). For each variant, users can access association records and corresponding published studies. Variant information on GenomicsDB also can be viewed.
Visualizing genetic associations
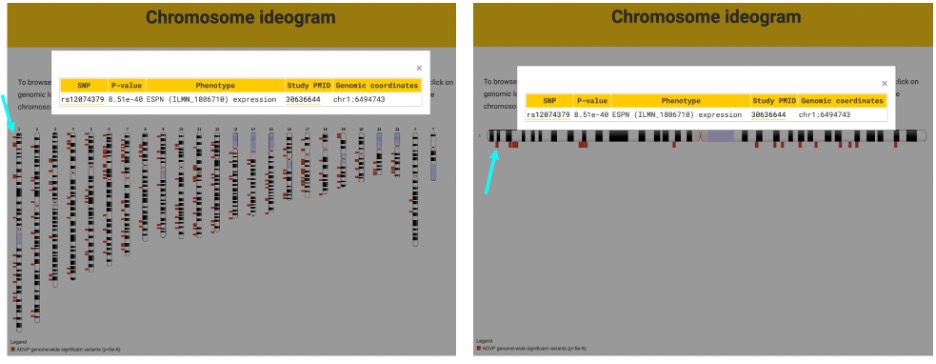
ADVP also allows visualization of curated variants through its Variant viewer feature. In the Chromosome ideogram, clicking on a genomic locus marker (e.g., rs12074379) opens a variant table that displays the variant identifier, p value, phenotype (e.g., AD or ADRD), study PubMed ID (PMID), and genomic coordinates (Figure 4, left). Variants also can be browsed by clicking on a specific chromosome, which yields an enlarged view of the chromosome and associated genomic loci. In this view, clicking on a genomic locus marker displays the same informational table (Figure 4, right).
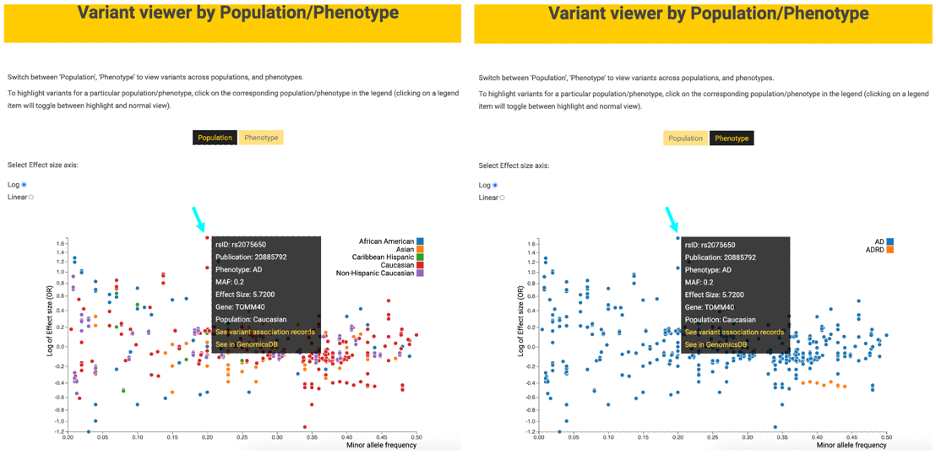
Population-based association views
In Variant viewer, ADVP curated variants (e.g., rs2075650) also can be visualized by population or phenotype across African American, Asian, Caribbean Hispanic, Caucasian, and Non-Hispanic Caucasian populations or by AD/AD-related dementias (ADRD) phenotype (Figure 5). Selecting a specific variant (e.g., rs2075650) shows the identifier, publication, phenotype, minor allele frequency (MAF), effect size, nearest gene, and population. Association records and data in GenomicsDB for specific variants also can be accessed.
Outlook
The number of AD GWAS studies is growing; thus, new publications and data will be added continuously to the ADVP, and updates will be released every 12 months. According to Dr. Leung, the next release “will increase the number of curated papers and records by at least 50 percent.”
Future plans for the portal include the addition of AD whole-genome and whole-exome sequencing analyses, AD xQTL associations, and GWAS data for ADRD and other neurodegenerative disorders.
In describing the usefulness of the ADVP, Dr. Leung describes this resource as “great for people who want introductory knowledge or in-depth understanding of AD genetics findings.”